US-South Timberland Transaction update
-----------------
The pace of timberland transactions is still pretty slow but they are occurring (about 500,000 acres since my update last fall) and prices do not appear to have dropped below those of late last year. I think the 10% - 15% decline estimate (from the peak) is still pretty solid. In some places it is more than that, some locations, less. The NCREIF index continues to show declining timberland values but the total decline from the peak is only about 7% as of the end of Q1. The capital appreciation component of the index, which measures change in market value, fell 6.17% last year and another 0.84% in Q1. Given the lagging and "smoothing" nature of the index, we will probably see it continue to decline modestly.
The list below represents the significant transactions since my last update
![]() Changing discount rates used by buyers and sellers are the key to changing timberland valuations. As discount rates go up, valuation goes down.
Changing discount rates used by buyers and sellers are the key to changing timberland valuations. As discount rates go up, valuation goes down.
The 2009 Q4 Brookfield Global Timberlands Research Report, distributed by Forestweb, stated that "Most appraisers are currently applying discount rates of + 6.0% (real) ... This represents an increase of 25 - 100+ bps Y/Y which should equate to a 4 - 15 percent reduction in timberland values when using a discounted cash flow analysis." In a presentation earlier this month by Plum Creek at the NAREIT Institutional Investor Forum, they estimated that discount rates have increased by about 1% which would put it right at the 15% reduction. On the other hand, a recent article discussing office building REITs suggested that discount rates were actually beginning to move down!
The graph below, which shows the relationship between discount rates and timberland prices, was produced by Jim Rinehart with R&A Investment Forestry.
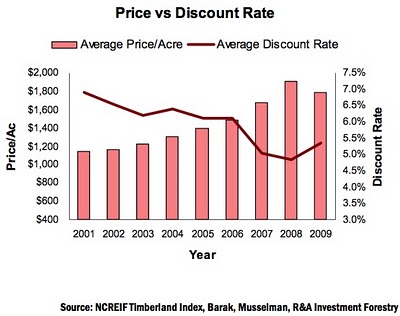 cautions that there are some inherent weaknesses in the individual data points due to the way the data was constructed. Be that as it may, the value of the graph is in the trend lines. And the trend is clear. The graph was taken from a paper titled "U.S. Timberland post-recession. Is it the same asset?" The paper is well worth reading and can be downloaded from his web site here.
The clear point is that there remains uncertainty in the market about discount rates and the direction of timberland values. My personal opinion is that we will not see big shifts in either direction in the short run but you had better pay attention to what is happening. Remember, timberland is not a very liquid investment as has been borne out by the limited transactions being reported.
If I have missed any sales, or have any errors, please send me an email at jbfiacco@gmail.com. As always, comments and differing opinions are appreciated (especially when supported by facts!). --Brian
Visit my web site at www.timberlandstrategies.com
---------------
